matplotlib plot

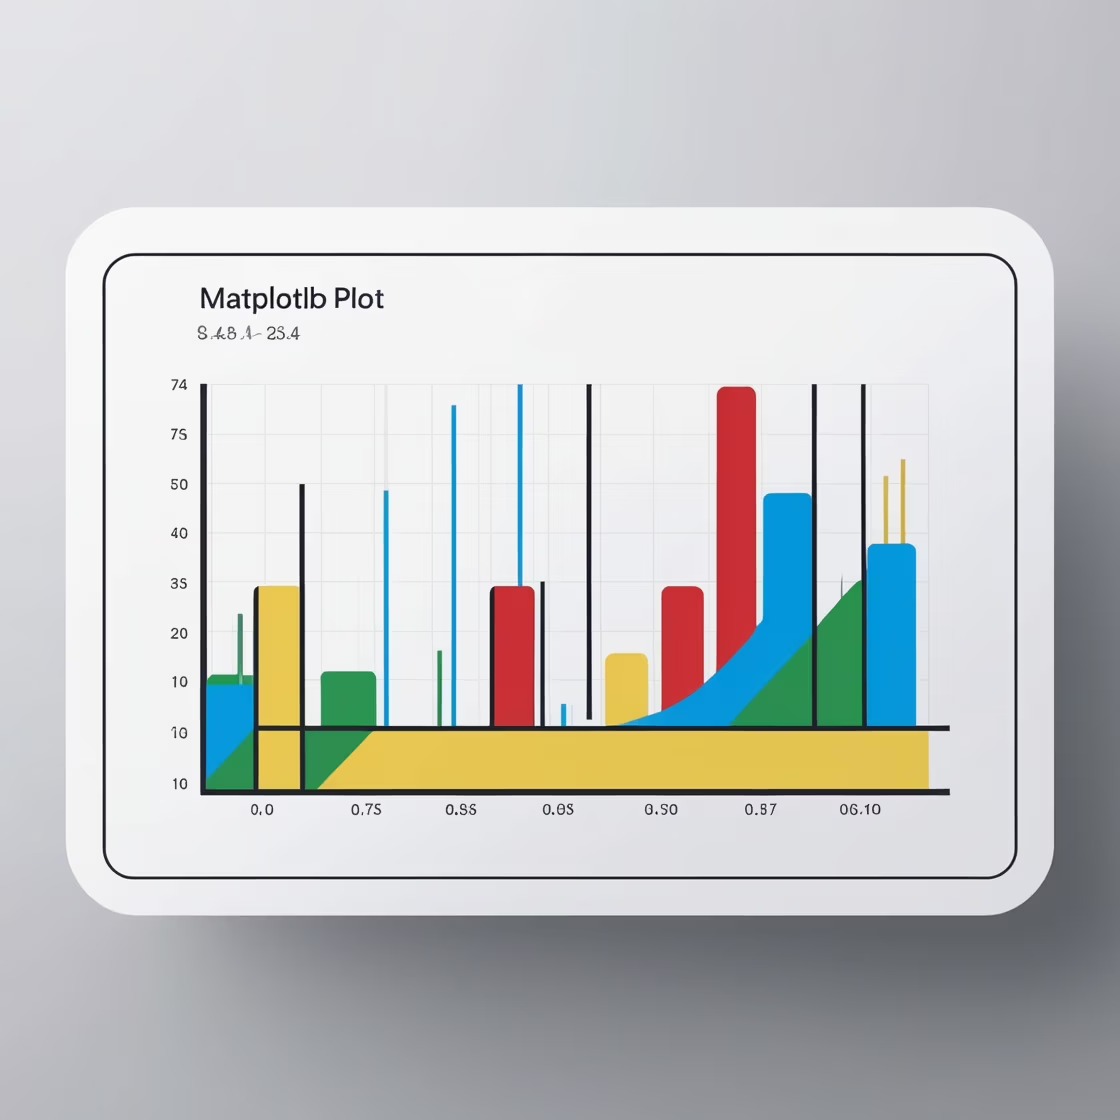
How to Use Matplotlib to Create Stunning Plots in Python

Matplotlib Plots is one of the other powerful Python libraries for data visualization. In other words, it enables the user to create static, animated, and interactive plots with a variety of types. The article will cover the essentials of Matplotlib by explaining how to set up a version of it, creating basic plots, customizing plots,…

Advanced Google Analytics Techniques

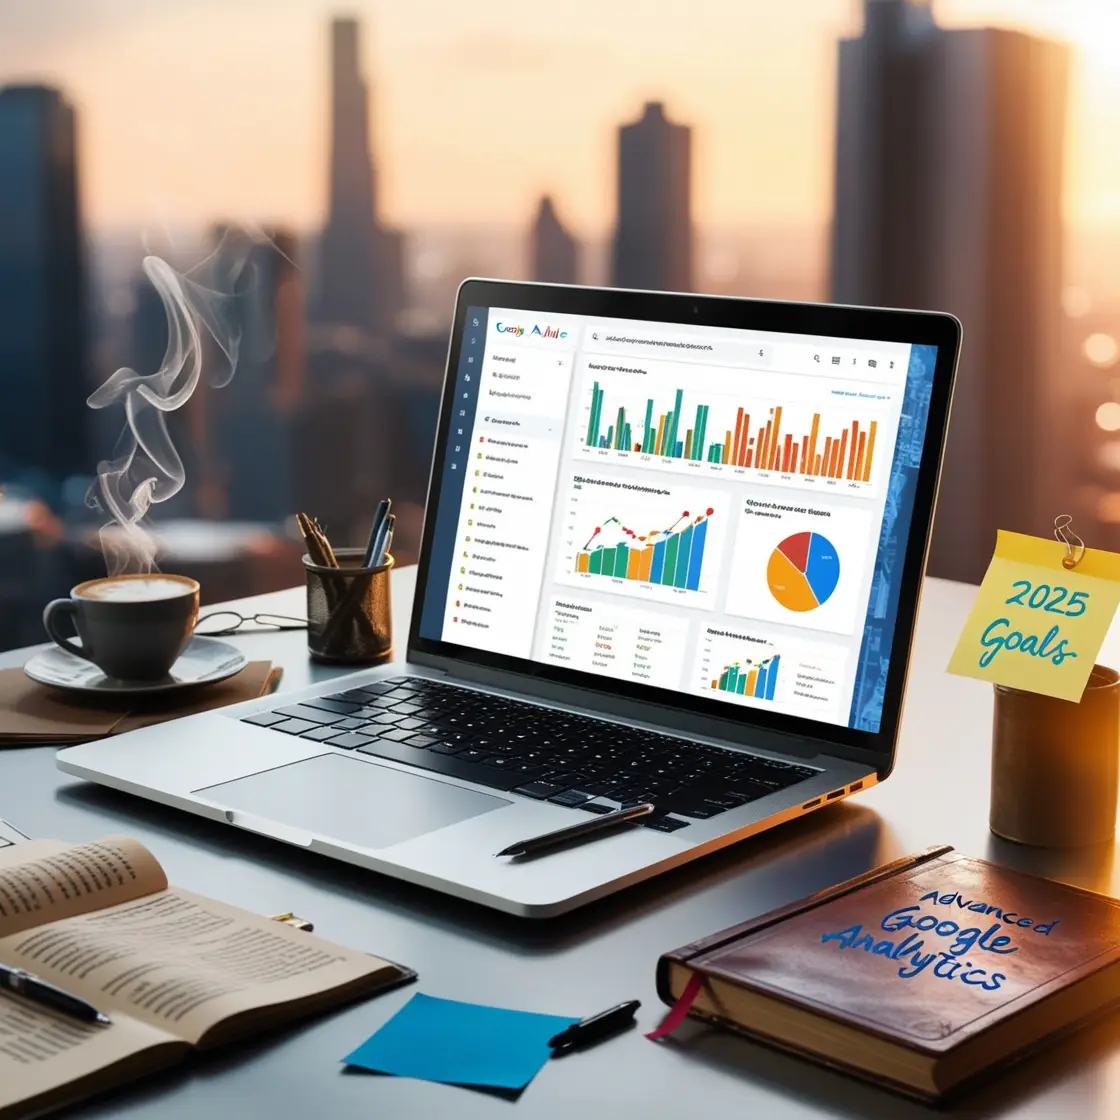
Mastering Advanced Google Analytics Techniques for Superior Insights in 2025

Advanced Google Analytics techniques provide powerful tools to extract deeper insights from your web data. These techniques, including custom dimensions, event tracking, and advanced segmentation, help marketers and analysts optimize website performance more effectively. By leveraging enhanced e-commerce tracking and setting up custom reports, businesses can better understand user behavior and boost conversion rates. Advanced…

Google Analytics Certification in 2025

Best Google Analytics Certification in 2025 for undergrad

Google Analytics Certification in 2025 is a valuable credential for marketers, data analysts, and anyone seeking to improve their digital marketing expertise. This certification validates your ability to use Google Analytics to track, analyze, and report web data effectively. It enhances your skills in interpreting data, identifying trends, and making data-driven decisions to optimize business…

AI Excel Chart Editor Revolutionizing Data Visualization

AI Excel Chart Editor Revolutionizing Data Visualization

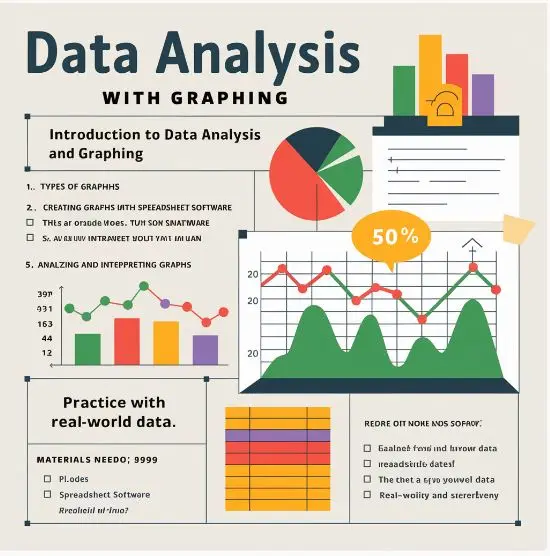
In today’s fast-paced digital world, data analysis and visualization are crucial for informed decision-making. With the rise of artificial intelligence (AI), these processes have become even more efficient and accessible. One of the most exciting advancements is the AI-powered Excel chart editor, a tool that simplifies data visualization by automating the creation of charts and…

| | |

Data Science Course Syllabus in 2025

A well-rounded data science course syllabus in 2025 is crucial for developing the skills needed to excel in the data-driven world. Whether you’re pursuing a full-time degree, an online certification, or a self-paced learning program, the syllabus typically covers the essential tools, techniques, and theoretical foundations of data science. This article provides a detailed breakdown…

How to Create a Power BI Resume That Stands Out

How to Create a Power BI Resume That Stands Out

Power BI Resume As business intelligence and data analytics tools like Power BI continue to gain traction, many professionals are building careers around mastering this platform. Whether you’re a seasoned BI developer or just starting out, having a well-structured Power BI resume is essential to showcasing your skills to potential employers. This guide will walk…

Best Power BI Alternatives for Linux

Best Power BI Alternatives for Linux

Best Power BI Alternatives for Linux, Power BI is one of the most popular business intelligence tools available, but unfortunately, it’s not natively supported on Linux. If you’re a Linux user looking for a powerful data visualization and analytics tool, several alternatives can fulfill your needs. Below are some of the best Power BI alternatives…

AI chatbot medical diagnosis image

AI chatbot medical diagnosis image

AI chatbots medical diagnosis image are transforming the healthcare sector by assisting in medical diagnosis through image analysis. These chatbots use advanced AI models to process medical images like X-rays, MRIs, CT scans, and ultrasounds. The combination of conversational AI and image recognition technology allows for quicker, more accurate diagnosis of various medical conditions. How…

Best Format for 3D Velocity Data for Tecplot Visualization

Best Format for 3D Velocity Data for Tecplot Visualization

Tecplot, a powerful visualization software, is widely used in various scientific and engineering fields. To effectively visualize 3D velocity data, choosing the right data format is crucial. This article explores the most suitable formats for 3D velocity data in Tecplot, considering factors like compatibility, efficiency, and ease of use. Common Data Formats and Their Compatibility…

data and analytics Christus health
|

data and analytics Christus health

This article examines how Christus Health, a leading healthcare organization, harnesses data and analytics to improve patient outcomes and streamline operations. With a focus on enhancing patient care, optimizing resources, and supporting strategic decisions, Christus Health leverages advanced analytics to stay ahead in the competitive healthcare landscape. The article also highlights the organization’s robust technological…